Measure the level of social cohesion in the country;
Build an understanding of the dividing and unifying forces in society;
Inform programming and adjust interventions to better support the strengthening of social cohesion in the country.
The SCORE process in Moldova is led by the United Nations Office of the Resident Coordinator (UNRCO) and implemented by five United Nations agencies, the United Nations Development Programme (UNDP), the United Nations Children’s Fund (UNICEF), the United Nations Population Fund (UNFPA), the United Nations Entity for Gender Equality and the Empowerment of Women (UN Women), and the United Nations Office of the High Commissioner for Human Rights. The implementation of the SCORE Moldova is supported by the Association for Participatory Democracy (ADEPT), which is the local partner in the process. The data collection was carried out by CIVIS and CBS-AXA, both local survey companies.
The SCORE Process in Moldova
The SCORE draws inspiration from multiple scientific disciplines while being flexible enough to incorporate new research findings, global policy guidelines, and the realities of each local and regional context. The SCORE can also flexibly integrate different modalities of data collection as required, including surveys, discourse analysis, and expert assessments, and draws its strength from advanced analytical and statistical toolkits.
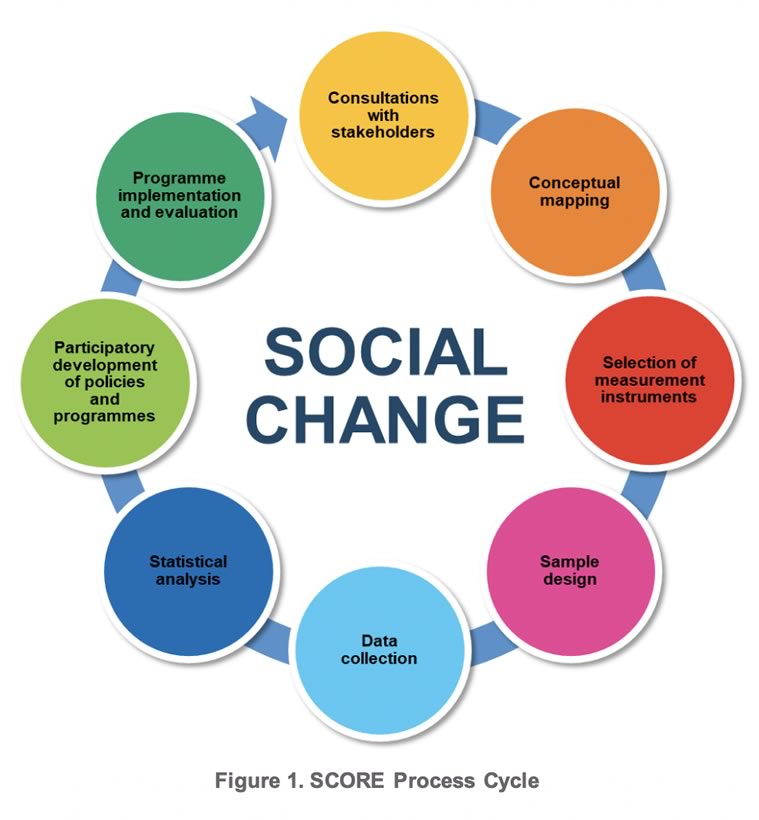
The SCORE process is based on participatory research and begins with inclusive consultations with a broad cross-section of national stakeholders, such as civil society, academia, government, business leadership, and local communities (Figure 1). These consultations contribute to an initial in-depth understanding of societal dynamics, informing the conceptual model for social cohesion in a particular country and the calibration of the SCORE questionnaire, which is constant across countries but adjusted to meet the idiosyncratic differences of each context.
 Figure 1.
Large SCORE sample frames are designed in a way to ensure that results can be reported with a high level of confidence for different subregions within the country but also for distinct societal groups of interest. In Moldova, for example, a booster sample of people residing in Gagauzia – an autonomous region in the country – was employed to allow for a better understanding of regional differences in responses. Results are processed using advanced data analysis techniques, including factor analysis, ANOVA analysis, regression, and structured equation modelling, from which robust metrics are designed for multiple indicators. These are then translated into network analysis and predictive models that can reveal the intricate relationships between different indicators and groups. This modelling process is used to suggest effective entry points to design evidence-based projects and policies.
The SCORE Moldova process includes two streams:
Adult SCORE Moldova, which covers people aged 18 and above; and
Youth SCORE Moldova, which covers people aged 14 to 18.
The first and pilot phase of the SCORE Moldova was calibrated in late 2016 and early 2017, with stakeholder consultations and numerous regional focus groups conducted across the country. Following the completion of the calibration process and conceptual modelling, the SCORE Moldova questionnaire for adults was designed, translated, and piloted. The quantitative fieldwork for the Adult SCORE Moldova was conducted between October 2017 and January 2018. The survey covered all regions of the country, excluding the Transnistrian region, and was conducted among 1558 adults, including a booster sample of 350 respondents residing in Gagauzia. The fieldwork for the adult component was conducted by CIVIS.
Based on the results of the calibration process, the questionnaire for youth was finalized at the beginning of 2018, and the data collection was conducted between March and April 2018. The survey among youth similarly covered all regions of the country, excluding the Transnistrian region, and was conducted among 1233 youth, including a booster sample of 356 respondents residing in Gagauzia. The fieldwork for the youth component was conducted by CBS-AXA.
Key Elements of the Adult SCORE Moldova
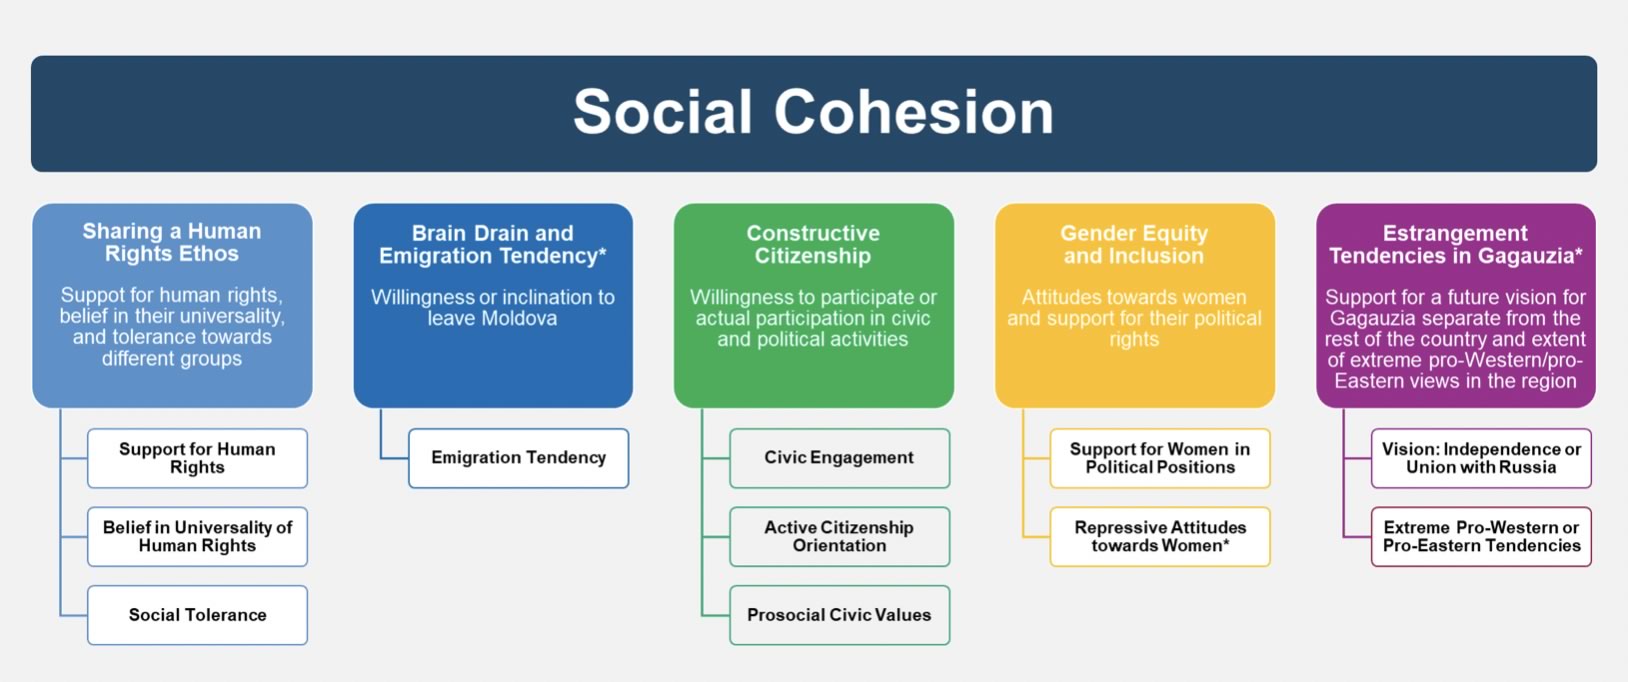
The Adult SCORE Moldova builds evidence to address issues within five key outcome areas (dimensions), which make up social cohesion. The five social cohesion outcomes are composed of one to three key indicators (Figure 2). 
Key Elements of the Youth SCORE Moldova
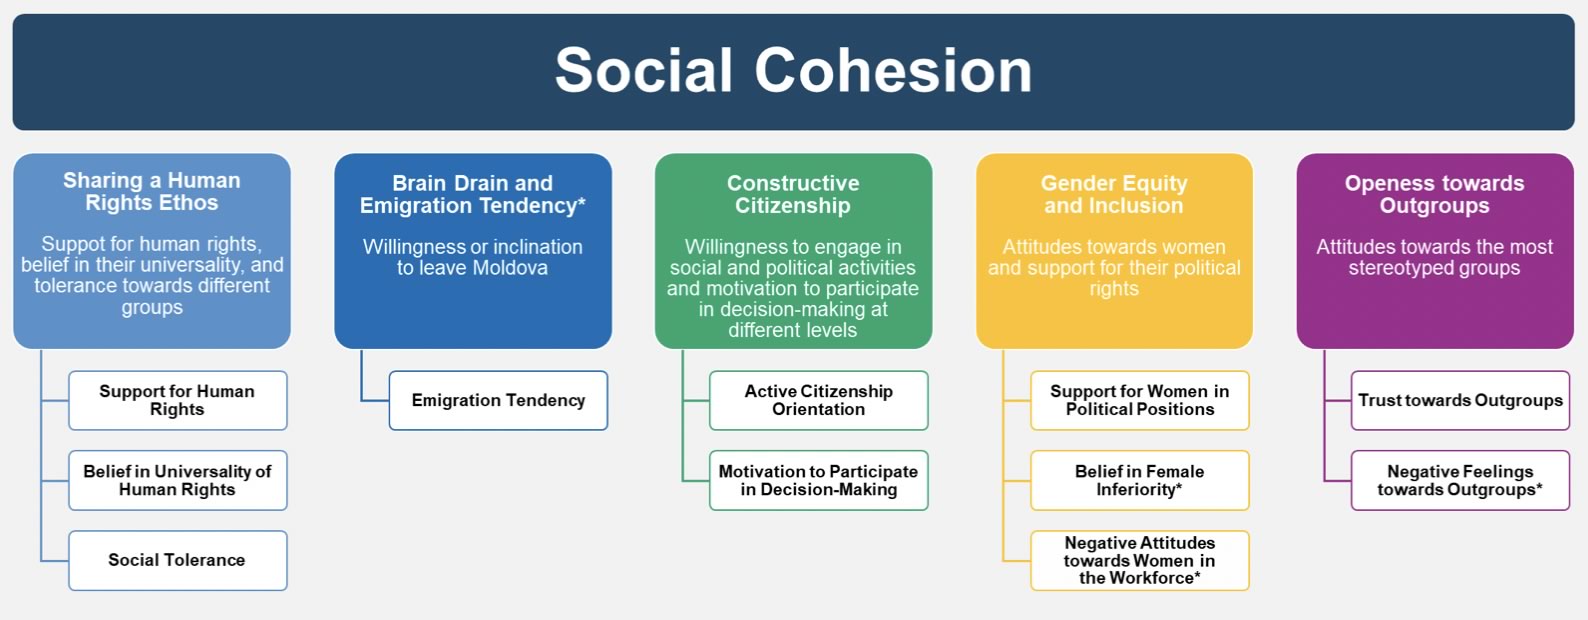
The Youth SCORE Moldova builds evidence to address issues within five key outcome areas (dimensions), which make up social cohesion. The five social cohesion outcomes are composed of one to three key indicators (Figure 3).

The SCORE Vocabulary
Simplified conceptual model: Theory of change and system map of different indicators, assumptions, and societal dynamics designed based on multi-level stakeholder consultations and simplified into a concise illustration. Initial conceptual models use fuzzy cognitive mapping and system mapping tools to map assumptions and hypotheses about multiple theories of change that guide the design of the SCORE indicators and questionnaire.
Outcomes of interest/dimensions: Identified desirable and high-priority normative objectives that relate to assessing and fostering social cohesion in a given context (i.e. intergroup harmony, mitigating violent tendencies, fostering a human rights ethos). These outcomes are listed under the dimensions section of the SCORE Platform but should not be confused with categorical/thematic groupings. The outcomes of interest that make up the key components of social cohesion for Moldova are illustrated in the figure above. The other dimensions listed on the SCORE platform are categories that group different indicators thematically.
Indicators: The components of the conceptual model are translated into metrics and indicators that are quantifiable and measurable via public opinion polls. Each indicator that is measuring a particular phenomenon (e.g. economic security, discrimination towards outgroups, belief in human rights, support for certain policy options, post-traumatic stress disorder, etc.) is usually assessed with minimum 3 questionnaire items, scaled following reliability tests, to ensure that the SCORE can robustly capture different dynamics underlying the given indicator.
Drivers/Predictors: Indicators that have a strong positive or negative impact on the outcome of interest are called drivers or predictors. They provide strategic entry points that hold the most likelihood of impact on the desired outcome of interest. These can be seen under the path analysis section.
Heatmaps: A score is calculated for each indicator. The scores range from 0 to 10, where 0 means that the phenomenon the indicator is measuring is not observed in the context at all, and 10 means that it is observed strongly and prevalently. Heatmaps demonstrate the regional differences of these scores in order to identify areas of concern and tailor interventions more precisely. For example, the Personal Security indicator is measured through the following questions in Moldova:
To what extent do you feel safe from violence in your daily life?
To what extent do you feel confident that the police or other institutions can protect you from violence?
To what extent would you feel safe walking alone in the street at night?
A score of 0 for personal security would mean that no one in a given region feels secure at a personal level, while 10 would signify that every person feels absolutely secure. As such, a heatmap of personal security for Moldova illustrates the scores for each of the 5 development regions covered by the SCORE (Chisinau, North, Centre, South, and Gagauzia), allowing for an understanding of the regional variance in terms of personal security across the country.
Path analysis (predictive models): Based on advanced statistical analysis including regression, network analysis and structural equation modelling, predictive models investigate the relationship between different indicators and the outcomes of interest. Predictive models reveal those indicators that may have a reinforcing or mitigating influence on other indicators as well as the outcome. While the first wave of the SCORE can be used for identifying directional correlations and benchmarking, second and third waves of the SCORE, where temporal comparisons are possible, can help identify trends and causal relationships. The color of the connecting lines represents the nature of the relationship - blue symbolizes a positive correlation, and red symbolizes a negative correlation. The thickness of the lines represents the strength of the correlation – the thicker the line, the stronger the relationship. This section provides a brief preview of the SCORE methodology. To explore the SCORE methodology in more detail, you can download the SCORE book or explore other SCORE publications.