SCORE is a robust scientific assessment tool that is carefully calibrated to each context to investigate societal dynamics and guide evidence-based policy and programme design for enhancing social cohesion. For a more detailed explanation of SCORE methodology, please read the short methodology paper
here.
The SCORE in Côte d’Ivoire was implemented by SeeD in partnership with Interpeace and Indigo Côte d’Ivoire with EU funding, with the general objectives of contributing to the peaceful and inclusive conduct of electoral processes and strengthening social cohesion. The SCORE Côte d’Ivoire findings also inform the 2016-2020 National Development Plan (PND) of the government of Côte d'Ivoire, in its first strategic axis which is aimed at "enhancing the quality of institutions and governance", and which includes supporting the consolidation of "Peace and Social Cohesion". The number of inter- and intra-community conflicts, an important indicator of the PND, is expected to decrease as a result of strengthening the peaceful and inclusive conduct of electoral processes.
The history of elections in Côte d'Ivoire shows cycles of violence and the recurrence of human rights violations. The 2011 post-electoral crisis claimed 3000 lives according to Amnesty International, while more recently, the October 2018 local elections confirmed the divisions between supporters of different political leaders and the potential for political violence at the community level, indicating the likelihood of elections to provoke or reignite deep social divides. In some localities, accusations of pressure, manipulation of the electoral process and falsification of the results were made during the local elections, and in some instances violent tensions arose between supporters. Due to the lack of oversight in the, often weakened, local democratic governance mechanisms, these cycles of political and electoral violence become amplified. These elements also apply to the high risk of confrontation which may become violent before, during or even after the 2020 elections.
The deficit in democratic governance and the history of violence escalation observed in three target districts (Abidjan District, Montagnes District, Vallée du Bandama District, identified by the Truth and Reconciliation Commission (CDVR), 2014) reveal a weakness in the culture of constructive dialogue, the sense of reconciliation within communities and in the participation of citizens in public and political life, issues which are often inflamed during electoral periods.
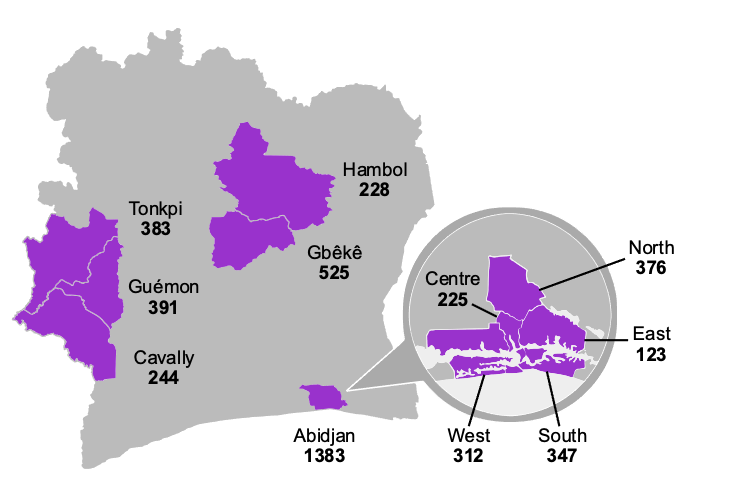
The identification of these districts informed the targeted sampling strategy of SCORE Côte d’Ivoire (Figure 1). The sample size of all regions within these districts reflects the representative proportion that they contribute to the full country population at district and regional level. Data collection was carried out by Indigo Côte d’Ivoire, reaching a total sample size of 3,154 respondents over the age of 18.
Figure 1. Regions sampled in SCORE Côte d’Ivoire and the corresponding sample size.
The key research questions of the SCORE in Côte d’Ivoire focused on the following areas of investigation:
- Identify and understand the drivers of political violence in order to inform evidenced-based policy and program recommendations for its mitigation
- Identify vulnerable groups in which there is a risk of tendency for political violence
- Understand the drivers of constructive citizenship and participation in Côte d’Ivoire
- Understand the drivers of democratic governance and the inclusive and peaceful conduct of electoral processes
- Utilise these predictive models of trends and behaviours which represent a risk of political and electoral violence, to inform and support civil society actors in the implementation of their actions
The indicators of SCORE Côte d’Ivoire, as well as the relationships between them can be explored and disaggregated interactively on this platform. For information on how to use the platform, you can watch the short video on our Facebook page
here or read the How to Read SCORE manual
here.
SCORE Process
Our evidence-based peacebuilding methodology combines an extensive participatory research process with advanced data analysis to identify the drivers of conflict dynamics and peaceful social change. It draws inspiration from multiple disciplines such as sociology, psychology, international relations and security studies and is flexible enough to incorporate new research findings, global policy guidelines and the realities of each local and regional context. The methodology is used to recommend peacebuilding solutions related to social cohesion and reconciliation, youth inclusion, gender empowerment, governance and anti-corruption and urban cohesion. The collection and interpretation of data in these areas allows us to provide policy recommendations, which predict how peacebuilding objectives might be achieved through the implementation of specific policies and projects. We invest in ongoing learning and innovation to improve our methodology so we can provide more inclusive and impactful policy and programme advice to governments and international organisations.
The first editions of our methodology were developed in 2012 in Cyprus in a partnership between UNDP and USAID. Our approach is based on participatory research and mixed methods, in which multi-level stakeholder consultations, focus groups and interviews inform the design and calibration of the questionnaire, which draws from our extensive library of measurement instruments and indicators. Our methodology is underpinned by a
Content Framework, which helps us align research objectives with the specific policy outcomes of different partners; a
Process Framework, which adopts participatory research principles and ensures local ownership of project results; and an
Analytical Toolkit, which combines different advanced statistical methods for scientifically robust investigation of SCORE data sets. For a brief summary of what each of these frameworks entail, please click
here.
SCORE Vocabulary
Dimensions are thematic categories that organise the different indicators on the platform. You can investigate multiple indicators organised under six different dimensions.
Indicators measure a particular phenomenon (e.g. economic security, active citizenship, level of education, tolerance to corruption etc.), the definition of which can be found in the glossary search box. Indicators are generally measured using a minimum of 3 questionnaire items and their validity confirmed using statistical reliability tests to ensure that the different dynamics underlying the indicator are well-captured. A score from 0 to 10 is calculated for each indicator. 0 means the phenomenon the indicator is measuring is not observed in the context at all, and 10 means that the phenomenon is prevalent. For example, if we want to denote the extent to which people feel safe from violence in daily life, a score of 0 would mean that no one feels secure, while 10 would signify that every person feels secure.
Heatmaps show how indicators are represented across different geographical areas, illustrating regional differences to identify areas of concern or priority to tailor policies and programmes and to improve resource allocation more precisely.
Path Analyses (Predictive Models) represent relationships between indicators based on advanced statistical analysis (e.g. regression, network analysis and structural equation modelling). In models, the relationships are directional, and they should be
read from left to right. They have predictive power and are used to identify key drivers of change in society. Models reveal what influences an indicator or what this indicator influences itself. Indicators can be “
drivers” as they positively or negatively predict the other indicators they are linked to. In a model, the indicator that the drivers are predicting is called an ‘outcome’. Outcomes are at the right end of the model, and they are usually the end goals that we want to influence. Red connecting lines in models represent a negative relationship and blue connecting lines represent a positive relationship between indicators. The thickness of arrows indicates the strength of the relationship between the indicators. Models should not be confused with correlations, where lines represent associations, but are not directional.