The SCORE for Eastern Ukraine methodology is carefully calibrated to the specific context of the eastern Ukraine, as is done in all other countries and regions where SCORE is implemented. Each SCORE wave starts with a series of consultations with local, regional and national stakeholders in Kyiv and the oblasts where it is implemented. During the consultations, the stakeholders (representatives of the authorities and civil society) identify the most important trends and developments of relevance for social cohesion. It is this participatory process that makes sure each SCORE is as contextually relevant as possible.
SCORE for Eastern Ukraine has built a library of more than 200 indicators since its first wave in 2017, deepening its reach and analysis with each wave. SCORE Eastern Ukraine sampling methodology is representative for the region and selected oblasts. Below is a summary of each SCORE Eastern Ukraine wave.
Wave 1: SCORE Eastern Ukraine 2017 also known as UN SCORE for Eastern Ukraine (USE) was implemented in partnership with SeeD, UNDP, UNICEF and IOM. The results were based on 5,429 face-to-face interviews with residents of the five oblasts in the east of Ukraine (1441 in Luhansk and 2156 in Donetsk oblasts, with additional 612 in Zaporizhzhia oblast, 613 in Dnipropetrovsk oblast and 606 in Kharkiv oblast). It also included an Expert scoring component and a School component. Expert scoring included 72 face-to-face in-depth interviews with two local experts in each of the raions in Donetsk and Luhansk oblasts. Schools component surveyed 3,300 children aged 13-17 sampled from 48 education facilities in Donetsk and Luhansk oblasts (government controlled areas).
Wave 2: SCORE Eastern Ukraine 2018 also known as UN SCORE for Eastern Ukraine (USE) was also was implemented in partnership with SeeD, UNDP, UNICEF and IOM. It was based on a survey of 5344 face-to-face interviews with residents of the five oblasts in the east of Ukraine (1407 in Luhansk and 2127 in Donetsk oblasts, with additional 600 interviews in Zaporizhzhia oblast, 610 in Dnipropetrovsk oblast and 600 in Kharkiv oblast). It also included a booster sample for the contact line in Donetsk and Luhansk oblasts, and conducted additional 700 interviews with respondents along the contact line.
Wave 3: SCORE Eastern Ukraine 2019 is funded by the USAID, implemented by SeeD in partnership with the UN Recovery and Peacebuilding Programme, and boasts the biggest sample size. The 2019 results are based on a survey of 9,054 face-to-face interviews. Main component consists of 3,325 respondents from government controlled areas and 619 in non-government controlled areas of Donetsk and Luhansk oblast. Additionally, booster samples included 1,810 respondents along the contact line and 300 ATO veterans, as well as urban boosters totaling 3,000 respondents from the 15 selected cities (Bakhmut, Berdiansk, Druzhkivka, Kostiantynivka, Kramatorsk, Lysychansk, Mariupol, Mariinka, Melitopol, Pokrovsk, Popasna, Sievierodonetsk, Sloviansk, Stanytia Luhanska, Starobilsk).
The data was collected in October-November 2019. The sampling strategy for the non-government controlled areas (NGCA) was different than SCORE’s stratified random sampling methodology applied to the GCA’s. In the NCGA, SCORE used snowball method where the interviewers were allowed to look for respondents using the chain of friends/acquaintances.
How to read SCORE?
SCORE for Eastern Ukraine is much more than a perception survey, which is why the results are not reported in the form of percentages. Instead, the results are presented in the form of descriptive and predictive analysis.
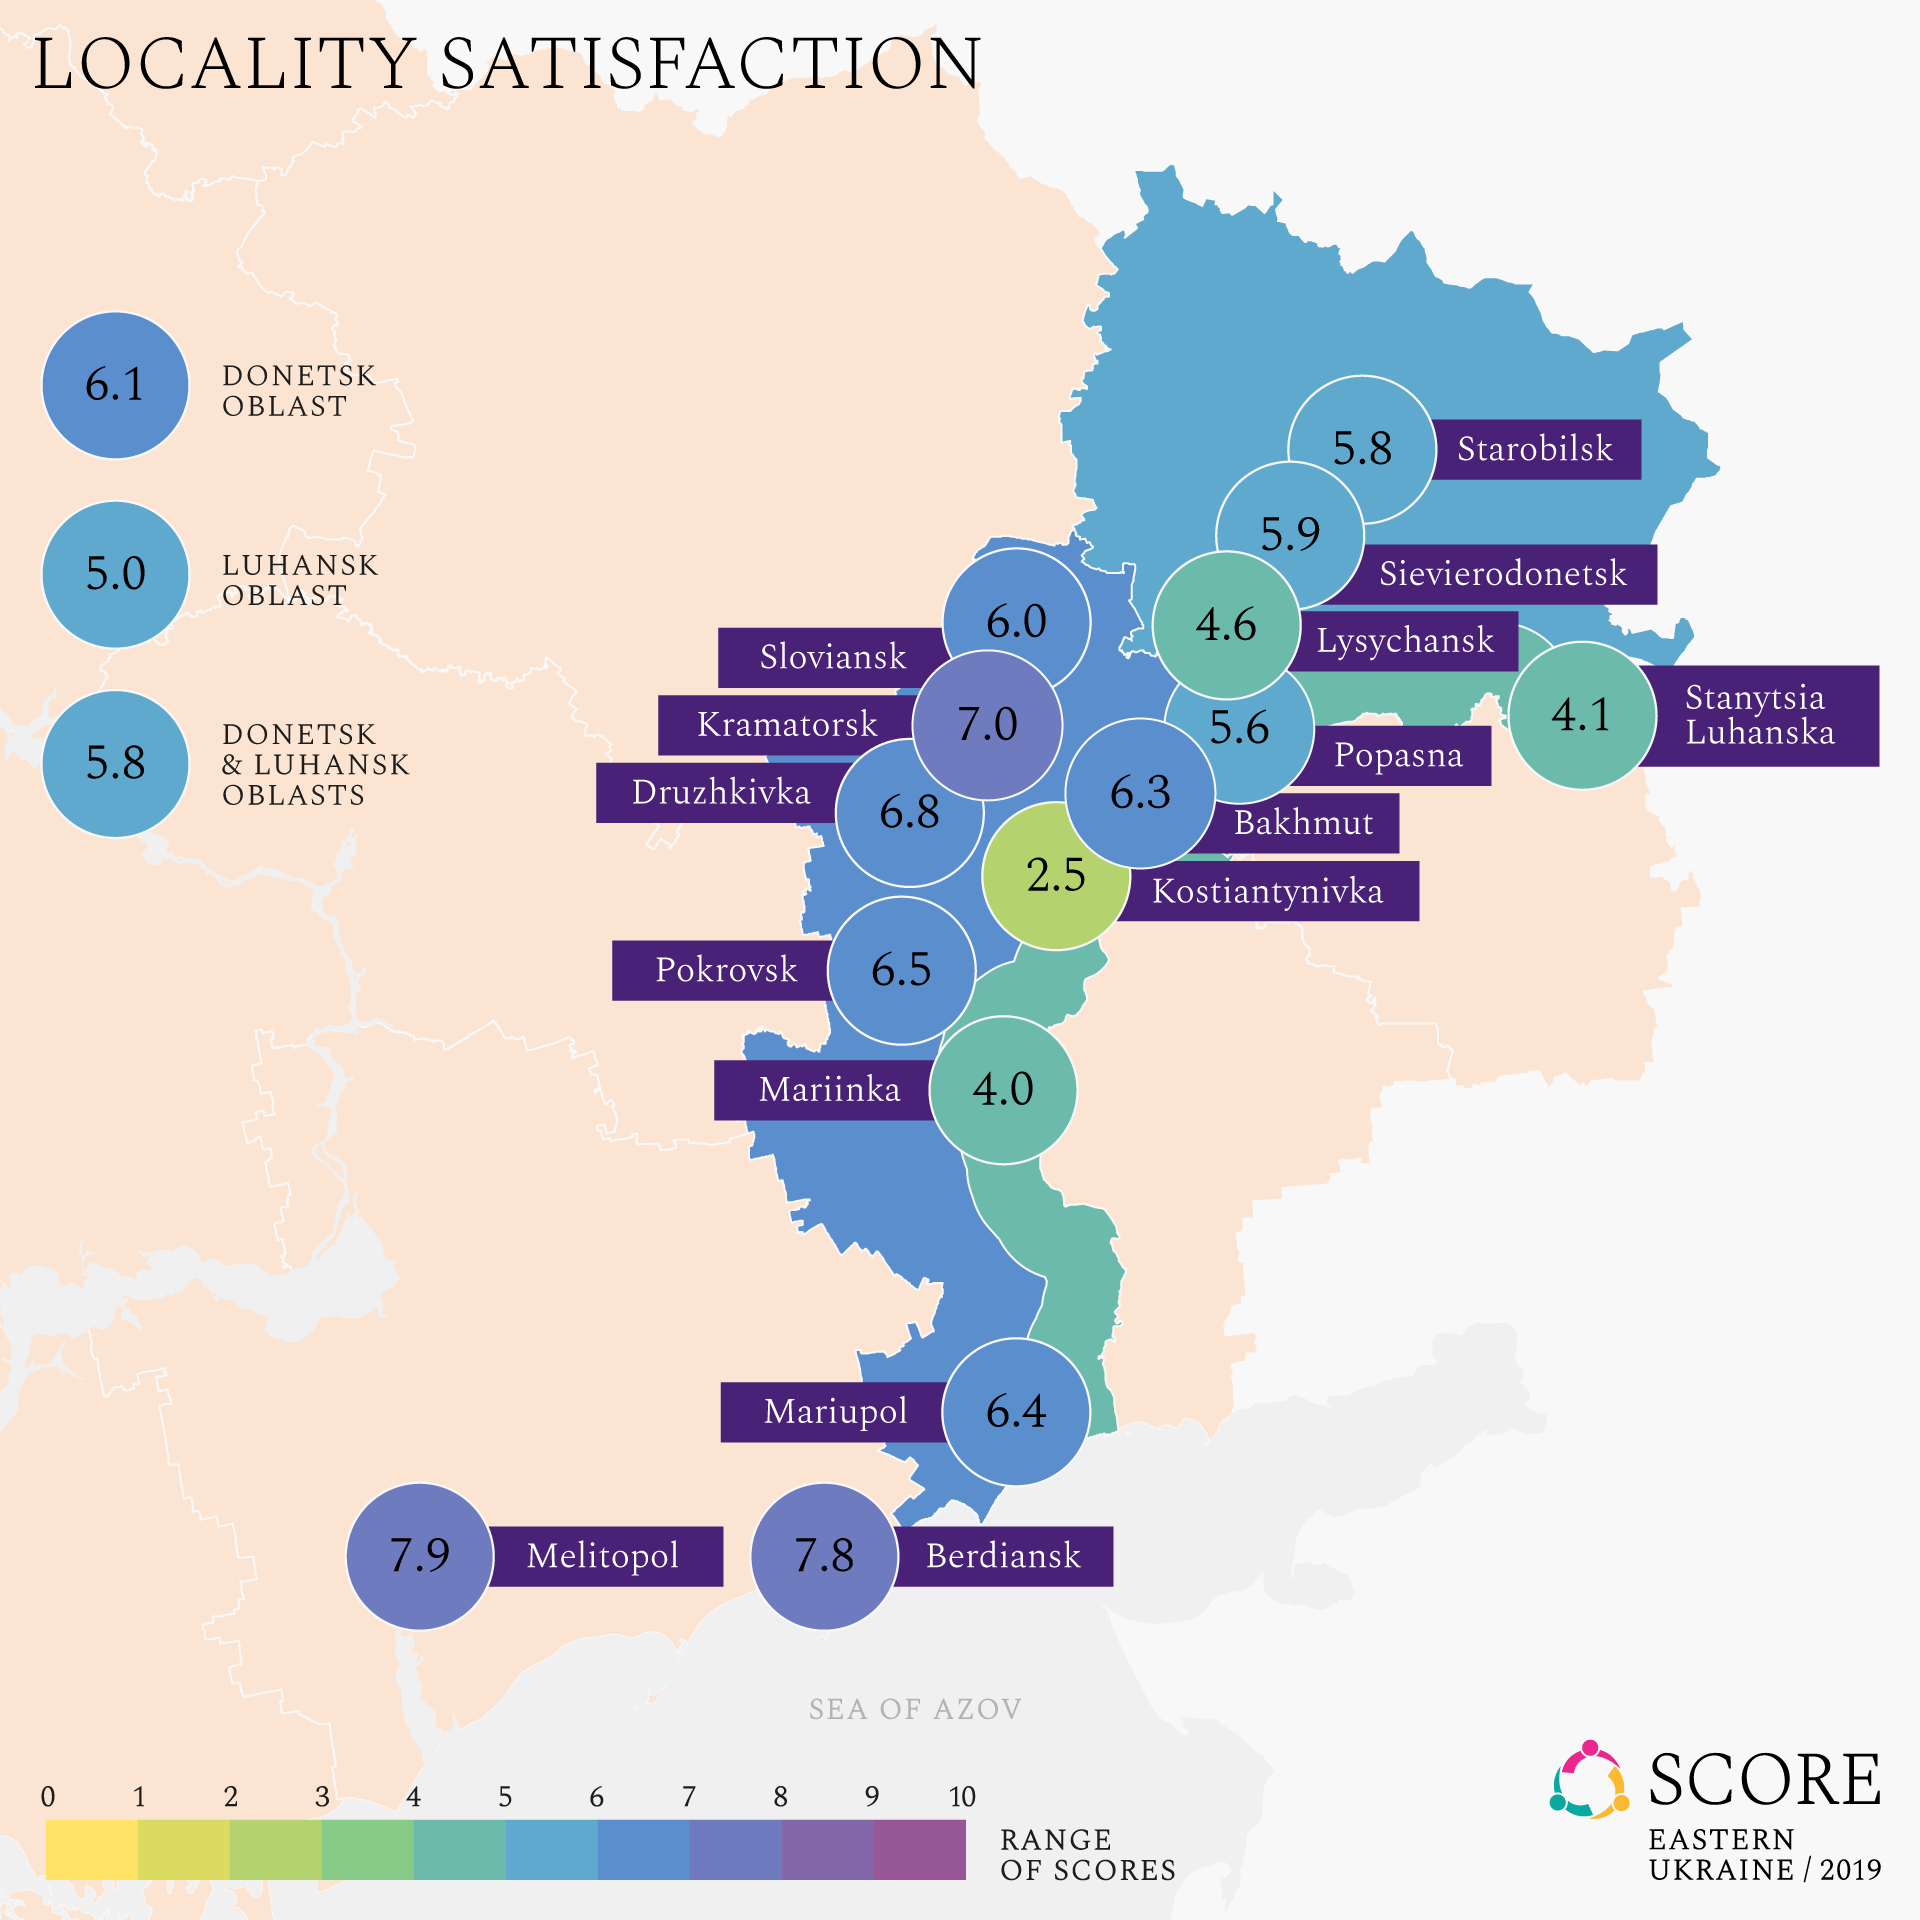
Heatmaps. The descriptive analysis is illustrated by the heatmaps, which show scores from 0 to 10 for each of the SCORE indicators. For example, the map below demonstrates the level of locality satisfaction on the measured territories: 0 would mean that no one in society feels satisfied with their locality and 10 – everyone is satisfied. The map tells us that residents of Konstiantynivka are the least satisfied with their locality, while Berdiansk and Melitopol ones share the highest scores.
 The predictive analysis
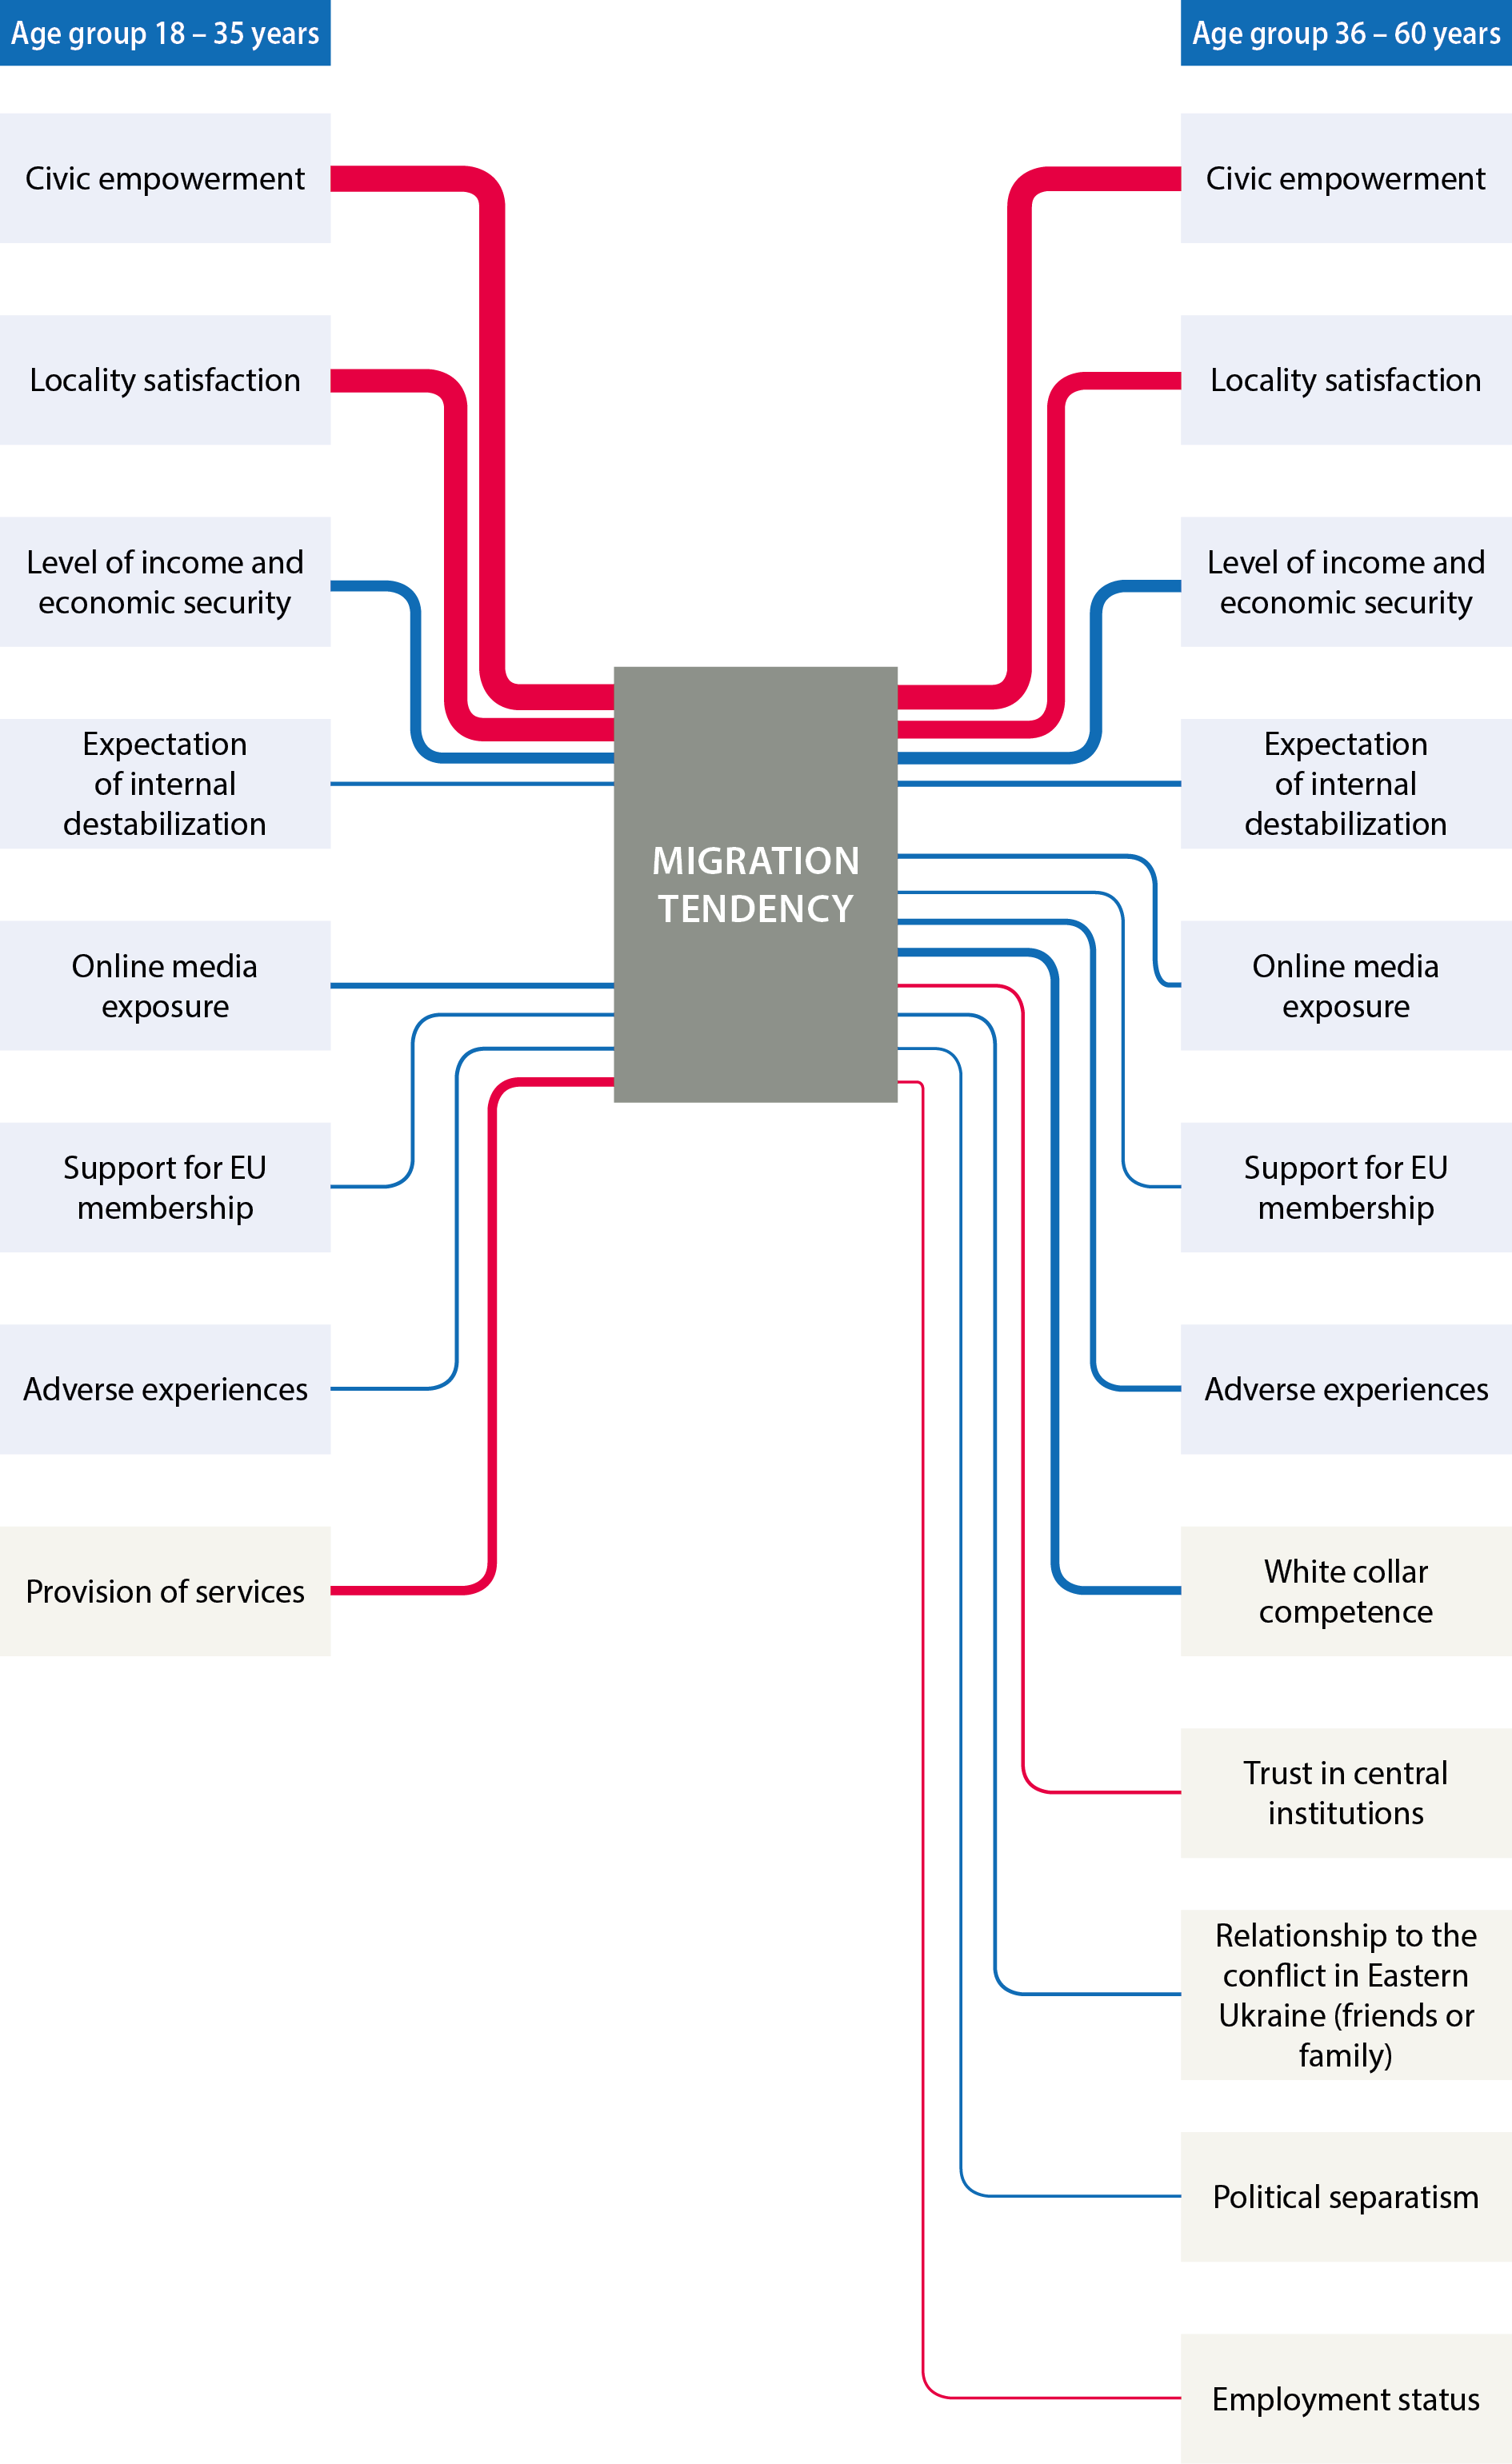
 is illustrated by the path analysis that shows how different indicators may influence other selected indicators/outcomes (such as migration tendency, trust in institutions, etc). Indicators may be either positively or negatively contributing to the outcome, meaning that they can either reinforce/strengthen (blue connecting lines) or inhibit/undermine (red connecting lines) the outcome. Such analysis helps identify strategic entry points to boost positive and desirable changes in society. In the example below, we can see that civic empowerment and satisfaction with your locality is undermining migration tendency and keeps people the most at their places of residence, while high level of income and economic security reinforces migration tendency, ‘helping’ people to move out.
Cluster analysis
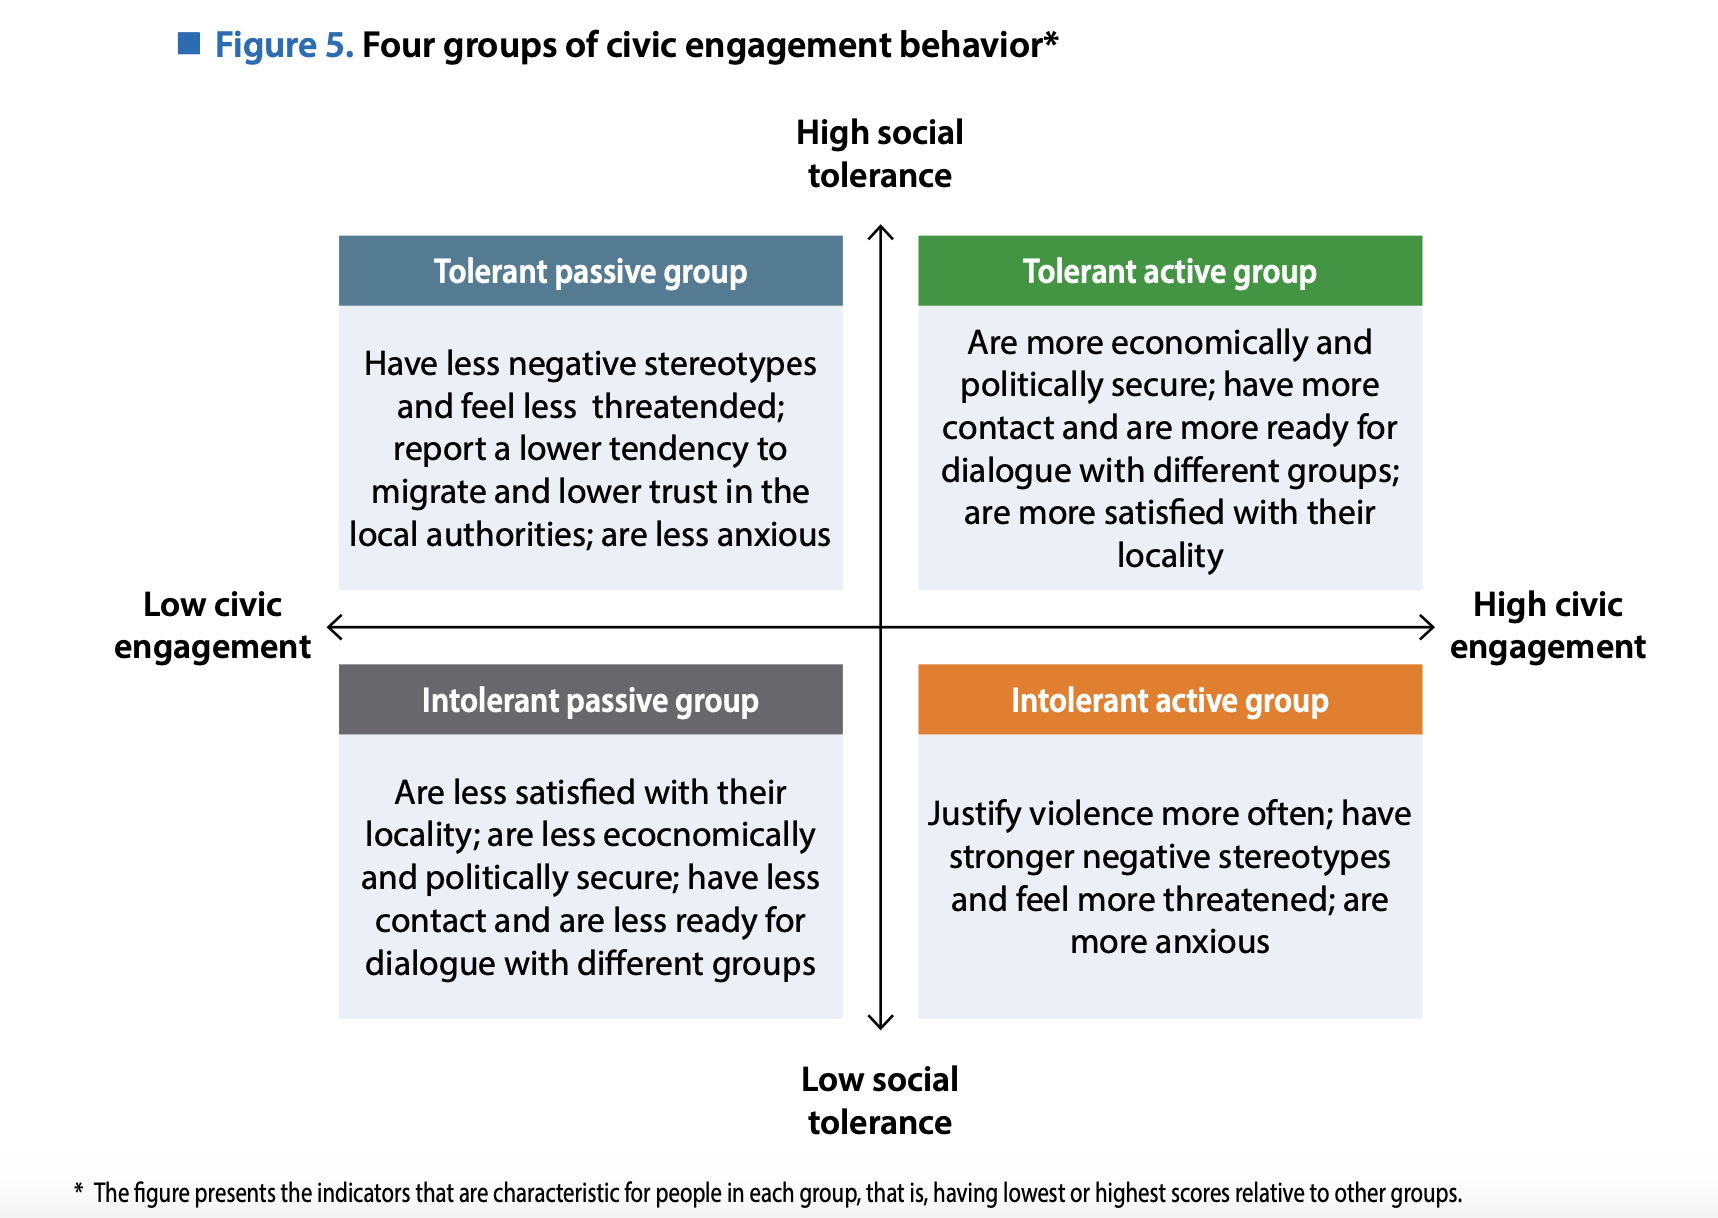
To understand how people are divided vis-a-vis certain indicators we use cluster analysis. After groups are statistically formed, we can see the main characteristics of each group and compare them. Cluster analysis helps to prioritize interventions and understand target audiences. For example, in 2018 our task was to understand who changemakers in our society are and if all types of civic activity are constructive. Thus, statistically we ended up with the four groups and their profiles presented below. This type of analysis can be find under different publications
here.
Thus, one can think that heatmaps answer a question ‘where’, predictive analysis – ‘how and why’ and cluster analysis – ‘who’, giving SCORE its depth of social cohesion.
For more on how to read SCORE and SCORE methodology, please visit the publications page.